Observation
Pre-coated silica gel HPTLC plates (60 F254) were used for the analysis of oxytocin content in different edible samples. The chromatographic profile of the sample was normal (well shaped), showing oxytocin as the main component (Fig. 4). Peak of oxytocin was identified using the solvent system as Methanol: Ammonia (pH 6.8) and there was no overlap with any other analyses of the sample. The chromatogram of oxytocin shown in fig. confirmed that standard oxytocin taken for study is pure.
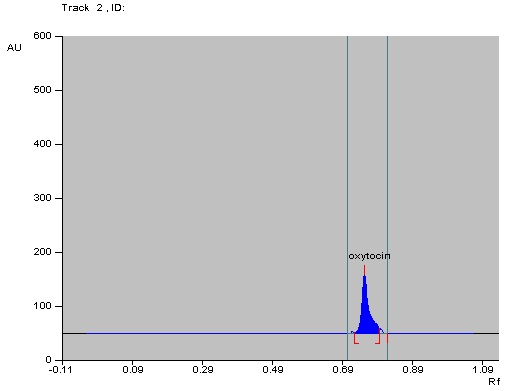
Chromatographic Profile of Standard Oxytocin
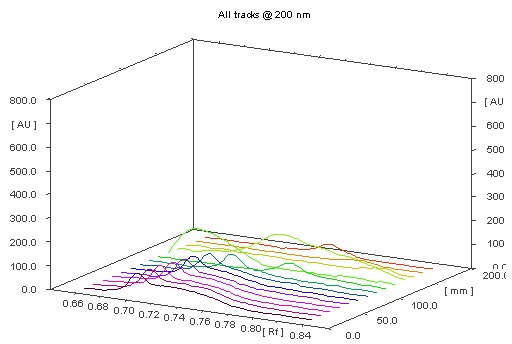
3D view of Oxytocin Analysis
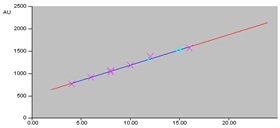
Linearity Curve for Oxytocin
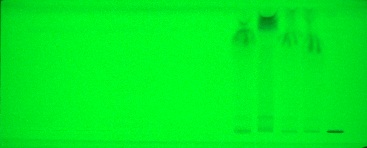
Image of the plate for Accuracy at 254nm
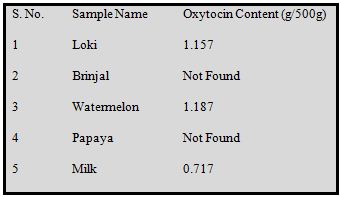
Table: Oxytocin Levels in Samples
Linearity curve for oxytocin
Bands of oxytocin were separated well on HPTLC silica plates by using solvent system Methanol: Ammonia (pH 6.8). Oxytocin peaks were identified and showed Rf value of 0.71 ± 0.02. Oxytocin content in vegetables, fruits and milk was found to be in the range of 11.82-15.05 ng/spot selected for study (Table 5). Linearity for oxytocin was studied by taking concentrations 5ng to 25ng.