


The chromatographic profile of the sample was simple, showing urea as the main component (Fig. 1). Urea is not UV active, so the plates were derivatized using the Ehrlich’s reagent (Fig. 2). Peak of urea was identified using the solvent system [n-propanol: Water:: 8:2 (v/v)] with the Rf value of 0.74 ± 0.03 and there was no overlap with any other analyses of the sample at 440 nm (Fig. 3).
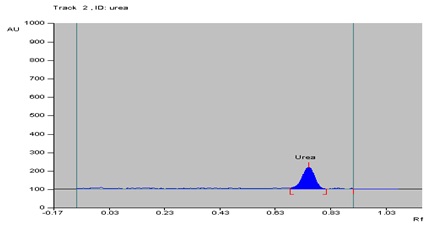
Fig. 1: Chromatogram of standard urea
Fig. 2: Derivatized image of urea
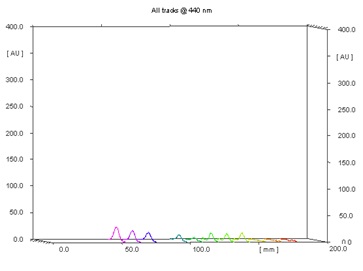
Fig. 3: 3D display of urea peaks
The linearity of the proposed method was confirmed in the range of 5-30 µg of standard urea. A linear regression of the data points for standard urea is resulted in a calibration curve with the equation Y=25.044 + 24.301x [regression coefficient (r2) = 0.99884, standard deviation (S.D.) = 2.77%] (Fig. 4). Urea content in milk samples were calculated and depicted in Table 1.
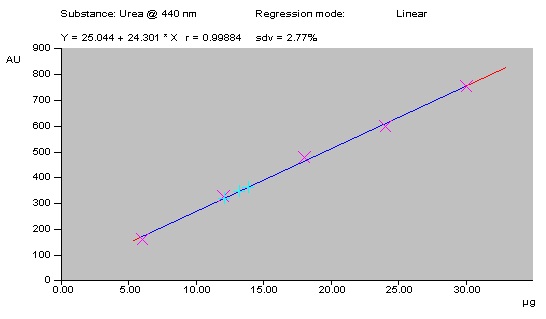
Fig. 4: Calibration curve of urea
Table 1: Cane sugars and lactose content in milk
| Milk Samples (%) | Urea (%) | SD (%) |
|---|---|---|
| Pure Milk | 0 (naturally occurring) | |
| Milk sample 1 | 02.16 | ± 0.50 |
| Milk sample 2 | 03.31 | ± 0.73 |
| Milk sample 3 | 04.48 | ± 0.82 |
The linearity, accuracy in terms of recovery % and precision was considered for the method. Validation of the method at three concentration levels was carried out by the standard recovery formula returned a mean of 92.24%. Precision (repeatability) was determined by running a minimum of four analyses and the coefficient of variability was found to be 2.892 %. The limit of detection (LOD) and quantification (LOQ) was found to be 0.37 and 1.13 µg respectively.