


Observation
Use of pre-coated silica gel HPTLC plates with n propanol :n butanol : ammonia :: ,7: 1: 4 ,resulted in good separation of the embelin at 333nm (Rf = 0.68). The absence of additional peaks in chromatogram indicates non- interference of the common excipients used. Regression analysis of the calibration data for caffeine showed that the dependent variable (peak area) and the independent variable (concentration) were represented by the equations Y = – 191.213 + 2.518 x for embelin in Embelia ribes and tamarind. The correlation of coefficient (r2) obtained was 0.99971 shows a good linear relationship.
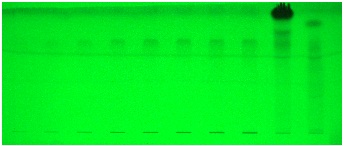
Fig. 1: Image at 254nm
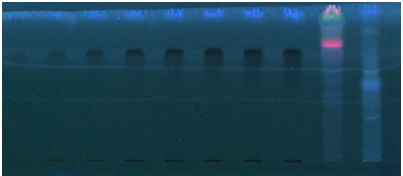
Fig. 2: Image at 366 nm
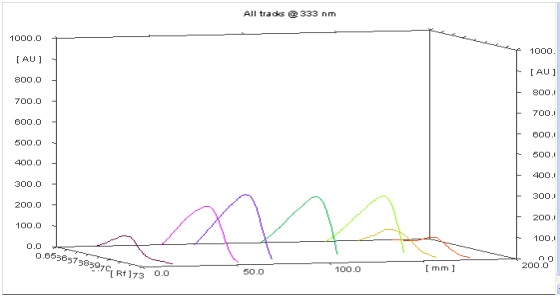
Fig. 3: 3D view of Embelin in different samples
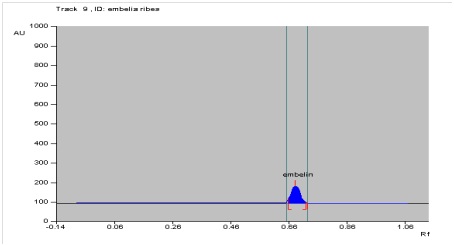
Fig. 4: Chromatogram for embelin
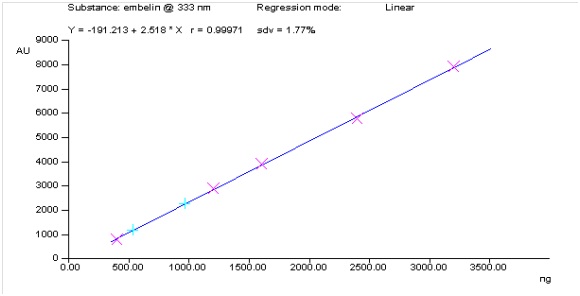
Fig. 5: Linearity graph for Embelin
Results:
Table 1: Quantification of the Embelin values in Samples
| S. No. | Sample | Amount of Embelin (mg/kg) |
|---|---|---|
| 1 | Embelia ribes | 1.939 |
| 2 | Tamarind | 1.073 |