


Observation
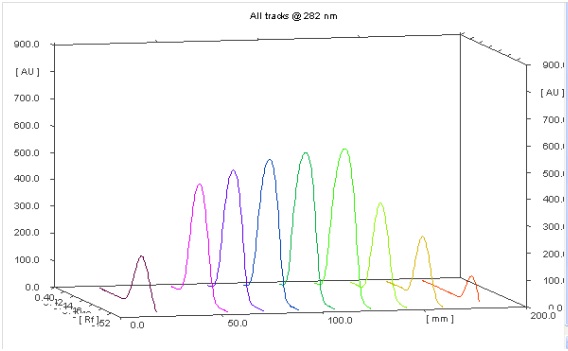
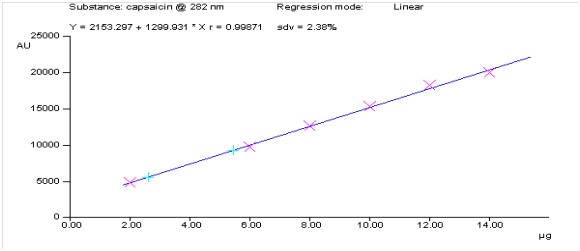
Use of pre-coated silica gel HPTLC plates with Chloroform: Methanol: Acetic acid (9.5:0.5:0.1) (v/v/v) resulted in good separation of the capsaicin at 282 nm (Rf 0.64). The absence of additional peaks in chromatogram indicates non- interference of the common excipients used. Regression analysis of the calibration data for capsaicin showed that the dependent variable (peak area) and the independent variable (concentration) were represented by the equations Y = 2153.297 + 1299.931 x for capsaicin in Red chili, Green chili and Capsicum. The correlation of coefficient (r) obtained was 0.9987 shows a good linear relationship.
Result Table: Capsaicin content in samples
| S. No. | Sample name | Capsaicin concentration (per 100g of chili extract) |
| 1 | Red chili | 5.145g |
| 2 | Green chili | 0.910g |
| 3 | Capsicum | 0* |